Summer Week 3: Hedgehogs - more SSFs, ABMs; TESSERA - OSM labels; Nature Cities note
Categories:EnvironmentAI/ML🦔Walkability
This past week, I’ve worked on a slightly wider variety of projects, though my hedgehogs remained a priority. I did a bit more work on the statistical movement modeling (not sure if there’s a need to continue in this direction in the following weeks), got a bit more familiar with a new foundational model currently being developed in the group, and started breaking the ground for a potential publication of my walkability thing.
Hedgehogs stats
Following up on last week, I tried to improve my integrated step selection analysis models to get some numerical representation of the hedgehogs’ actual preferences, at least in the area we have data for. Nonetheless, these statistical models are quite complex, and there are numerous considerations to take into account, as well as reflect on the use case of these coefficients. One of the major bottlenecks over the past few days has been that there isn’t a lot of documentation or even codebases I could take inspiration from, but I have gotten a sense that a deep understanding and strong prior beliefs are, ideally, available, in order to navigate towards clean convergences with no covariates breaking things. This is particularly the case when there isn’t a lot of tracking data.
Nevertheless, I think I’ve gotten some reasonable results by adjusting some of the parameters (e.g., when checking for quasi-separation), but also, more interestingly, by separating the transportation infrastructure features (roads) and using an exponential function to track their distance from the hedgehog checkpoints.
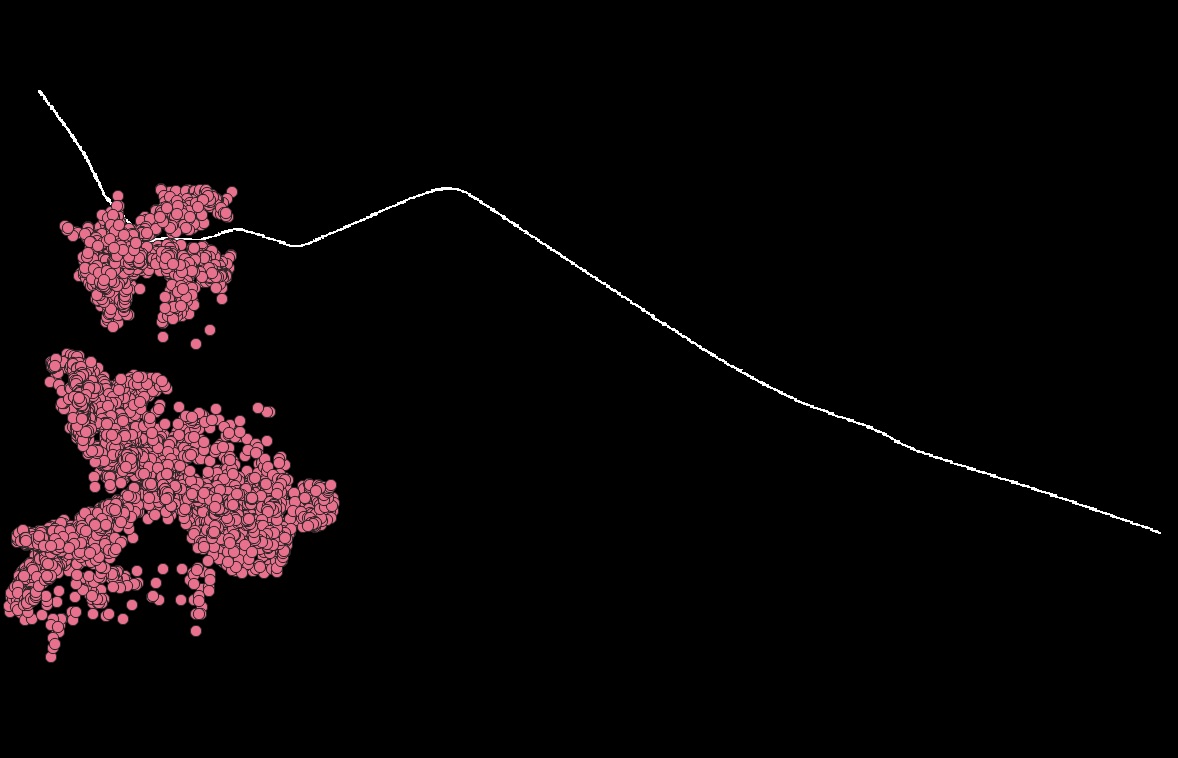
Once again, this is difficult due to the lack of data. Here, for instance, is an example of the singular ‘trunk’ road in the area of interest, surrounded by a number of hedgehogs, which, I think, is a bit tricky to deal with.
Nonetheless, here’s a summary of the final iSSA model I ran (mind the feature type merging necessary to prevent convergence/other issues + road merging when it seemed to make more sense):
| Term | Coef | exp(Coef) | SE | z | Pr(>|z|) | Significance |
|---|---|---|---|---|---|---|
| road_bridleway | 1.48626 | 4.42054 | 0.19510 | 7.618 | 2.58e-14 | *** |
| road_major_roads | -0.65993 | 0.51689 | 0.29589 | -2.230 | 0.025724 | * |
| road_paths_footways | 0.69877 | 2.01127 | 0.08402 | 8.316 | < 2e-16 | *** |
| road_residential_service | -0.00357 | 0.99644 | 0.07911 | -0.045 | 0.964006 | |
| road_steps | -1.79969 | 0.16535 | 0.63133 | -2.851 | 0.004363 | ** |
| road_tertiary | 0.03604 | 1.03669 | 0.13404 | 0.269 | 0.788040 | |
| road_track | 1.06772 | 2.90874 | 0.13894 | 7.685 | 1.53e-14 | *** |
| road_trunk | -1.34672 | 0.26009 | 0.66205 | -2.034 | 0.041934 | * |
| road_unclassified | -0.12629 | 0.88136 | 0.17467 | -0.723 | 0.469647 | |
| crop_grass | -0.07727 | 0.92564 | 0.03953 | -1.955 | 0.050639 | . |
| crop_maize | 1.00819 | 2.74063 | 0.17080 | 5.903 | 3.57e-09 | *** |
| crop_potatoes | 2.01594 | 7.50782 | 0.18798 | 10.724 | < 2e-16 | *** |
| landcover_arable_and_horticulture | -0.39265 | 0.67527 | 0.27258 | -1.441 | 0.149721 | |
| landcover_improved_grassland | 2.01544 | 7.50399 | 0.22197 | 9.080 | < 2e-16 | *** |
| landcover_suburban | 2.37281 | 10.72746 | 0.22175 | 10.701 | < 2e-16 | *** |
Furthermore, I also ran a quick analysis of the sleeping habitats hedgehogs using generalized linear mixed model (from the lme4 package). Here is the summary (higher the better):
| Fixed Effect | Estimate | Std. Error | z value | Pr(>|z|) | Significance |
|---|---|---|---|---|---|
| (Intercept) | -3.84956 | 0.09212 | -41.787 | < 2e-16 | *** |
| maize | 1.95984 | 0.35094 | 5.585 | 2.34e-08 | *** |
| no_crop | 0.46713 | 0.13019 | 3.588 | 0.000333 | *** |
| potatoes | 3.70124 | 0.34287 | 10.795 | < 2e-16 | *** |
| other crop | -0.42933 | 0.31858 | -1.348 | 0.177766 | |
| suburban | 2.12587 | 0.11155 | 19.057 | < 2e-16 | *** |
| other landuse | -2.17481 | 0.21592 | -10.072 | < 2e-16 | *** |
| bridleway | 1.43330 | 0.53319 | 2.688 | 0.007185 | ** |
| major_roads | 0.31383 | 0.60665 | 0.517 | 0.604935 | |
| paths_footways | 0.95050 | 0.23762 | 4.000 | 6.33e-05 | *** |
| residential_service | 0.58426 | 0.18808 | 3.106 | 0.001893 | ** |
| steps | -3.14517 | 2.05752 | -1.529 | 0.126359 | |
| tertiary | 0.32596 | 0.34010 | 0.958 | 0.337847 | |
| track | 1.22769 | 0.42308 | 2.902 | 0.003711 | ** |
| trunk | -0.73416 | 1.03250 | -0.711 | 0.477054 | |
| unclassified road | -2.19269 | 0.64586 | -3.395 | 0.000686 | *** |
Upon manual reviews, I’d say these coefficients generally help produce reasonable results in my agent-based model, but there’s no good verification. Hence, I’d certainly like to transition to a more external prior-based ABM approach, particularly because of that. I think having access to the coefficients could still be very useful, but I sort of think having an independent model could be much better in this context.
TESSERA
TESSERA is a remote sensing foundation model that learns 128-dimensional representations for every 10-meter pixel by encoding the time series from Sentinel data using dual transformers. It seems to have an enormous potential in downstream tasks, and it’s genuinely very exciting.
I had a chance to learn more about it and how it can be used this week at a labeling workshop at the Conservation Institute. It also became apparent that OSM data, at this stage, could be a great resource. Moreover, in the opposite direction, TESSERA could be an absolutely incredible way to supplement data to OSM… Consequently, I got a little bit involved, extracted some “natural” features from a certain requested region in Scotland, and passed them for further labeling use.
Few (potentially obvious) observations: up-to-date OSM data on a continental scale can be very easily obtained as .pbf, but for the preprocessing, using just the osmium package from terminal is exponentially faster than the Python packages I’ve always relied upon.
Publishing Walkability
Lastly, I would really like to try to publish my walkability project somewhere, and I started doing some preliminary work on it. nature cities would be a perfect opportunity, but lots of work needs to be done. Most of this work is (perhaps) quite straightforward, but the major issue is the evaluation. I do not know how to get a sufficient evaluation metric in a relatively short period of time, and nature cities is, very clearly, a very evaluation-driven, results-driven journal.
I hope I didn’t forget anything…