Summer Week 12: Big Brambles Finale & Index of the Summer's Work
Categories:EnvironmentAI/MLFoundationalML🦔Brambles
This week
With a slight delay, here’s the final blog post of the summer. The last week was quite eventful. Besides cleaning up some scripts (so that they could potentially be used in the future by someone else), we tested (in the field!) and improved my TESSERA-based bramble detection models. This, without a doubt, was not only a highlight of the summer, but also convinced me that the bramble detection models (whose utility I may have doubted beforehand) actually worked quite well.
Starting toolkit
As discussed in some of the previous posts, heading into this week, I had a KNN model trained on bramble sightings data from iNaturalist, particularly from an area near Manchester, with a high density of “scientific”-grade data points. To generate negative examples, I randomly sampled 1,000 points from the same area, with a significant distance from any known sightings of brambles.
However, even though I manually reviewed all of the used data points, the trained models did not seem to produce very realistic results.
Therefore, I pivoted to using iNaturalist data from the Cambridge area. While significantly scarcer, they were much easier to review and filter out obvious nonsensical entries. Using the same negative data from the Manchester area, I also expanded the datasets by a few brambles I had noticed in Cambridge before.
Furthermore, I expanded from using only a KNN to also using an MLP, logistic regression, random forrest, and SVM models.
Fieldwork
On Wednesday, Professor Madhavapeddy, Dr Jaffer, Shane Weisz, and I tested these models in Cambridge and its immediate surroundings. We began by driving to Milton, and from there used the outputs to guide our exploration (on foot or more driving). We noted the models’ performance for different kinds of brambles, collected more data, and otherwise exercised our knowledge of botany.
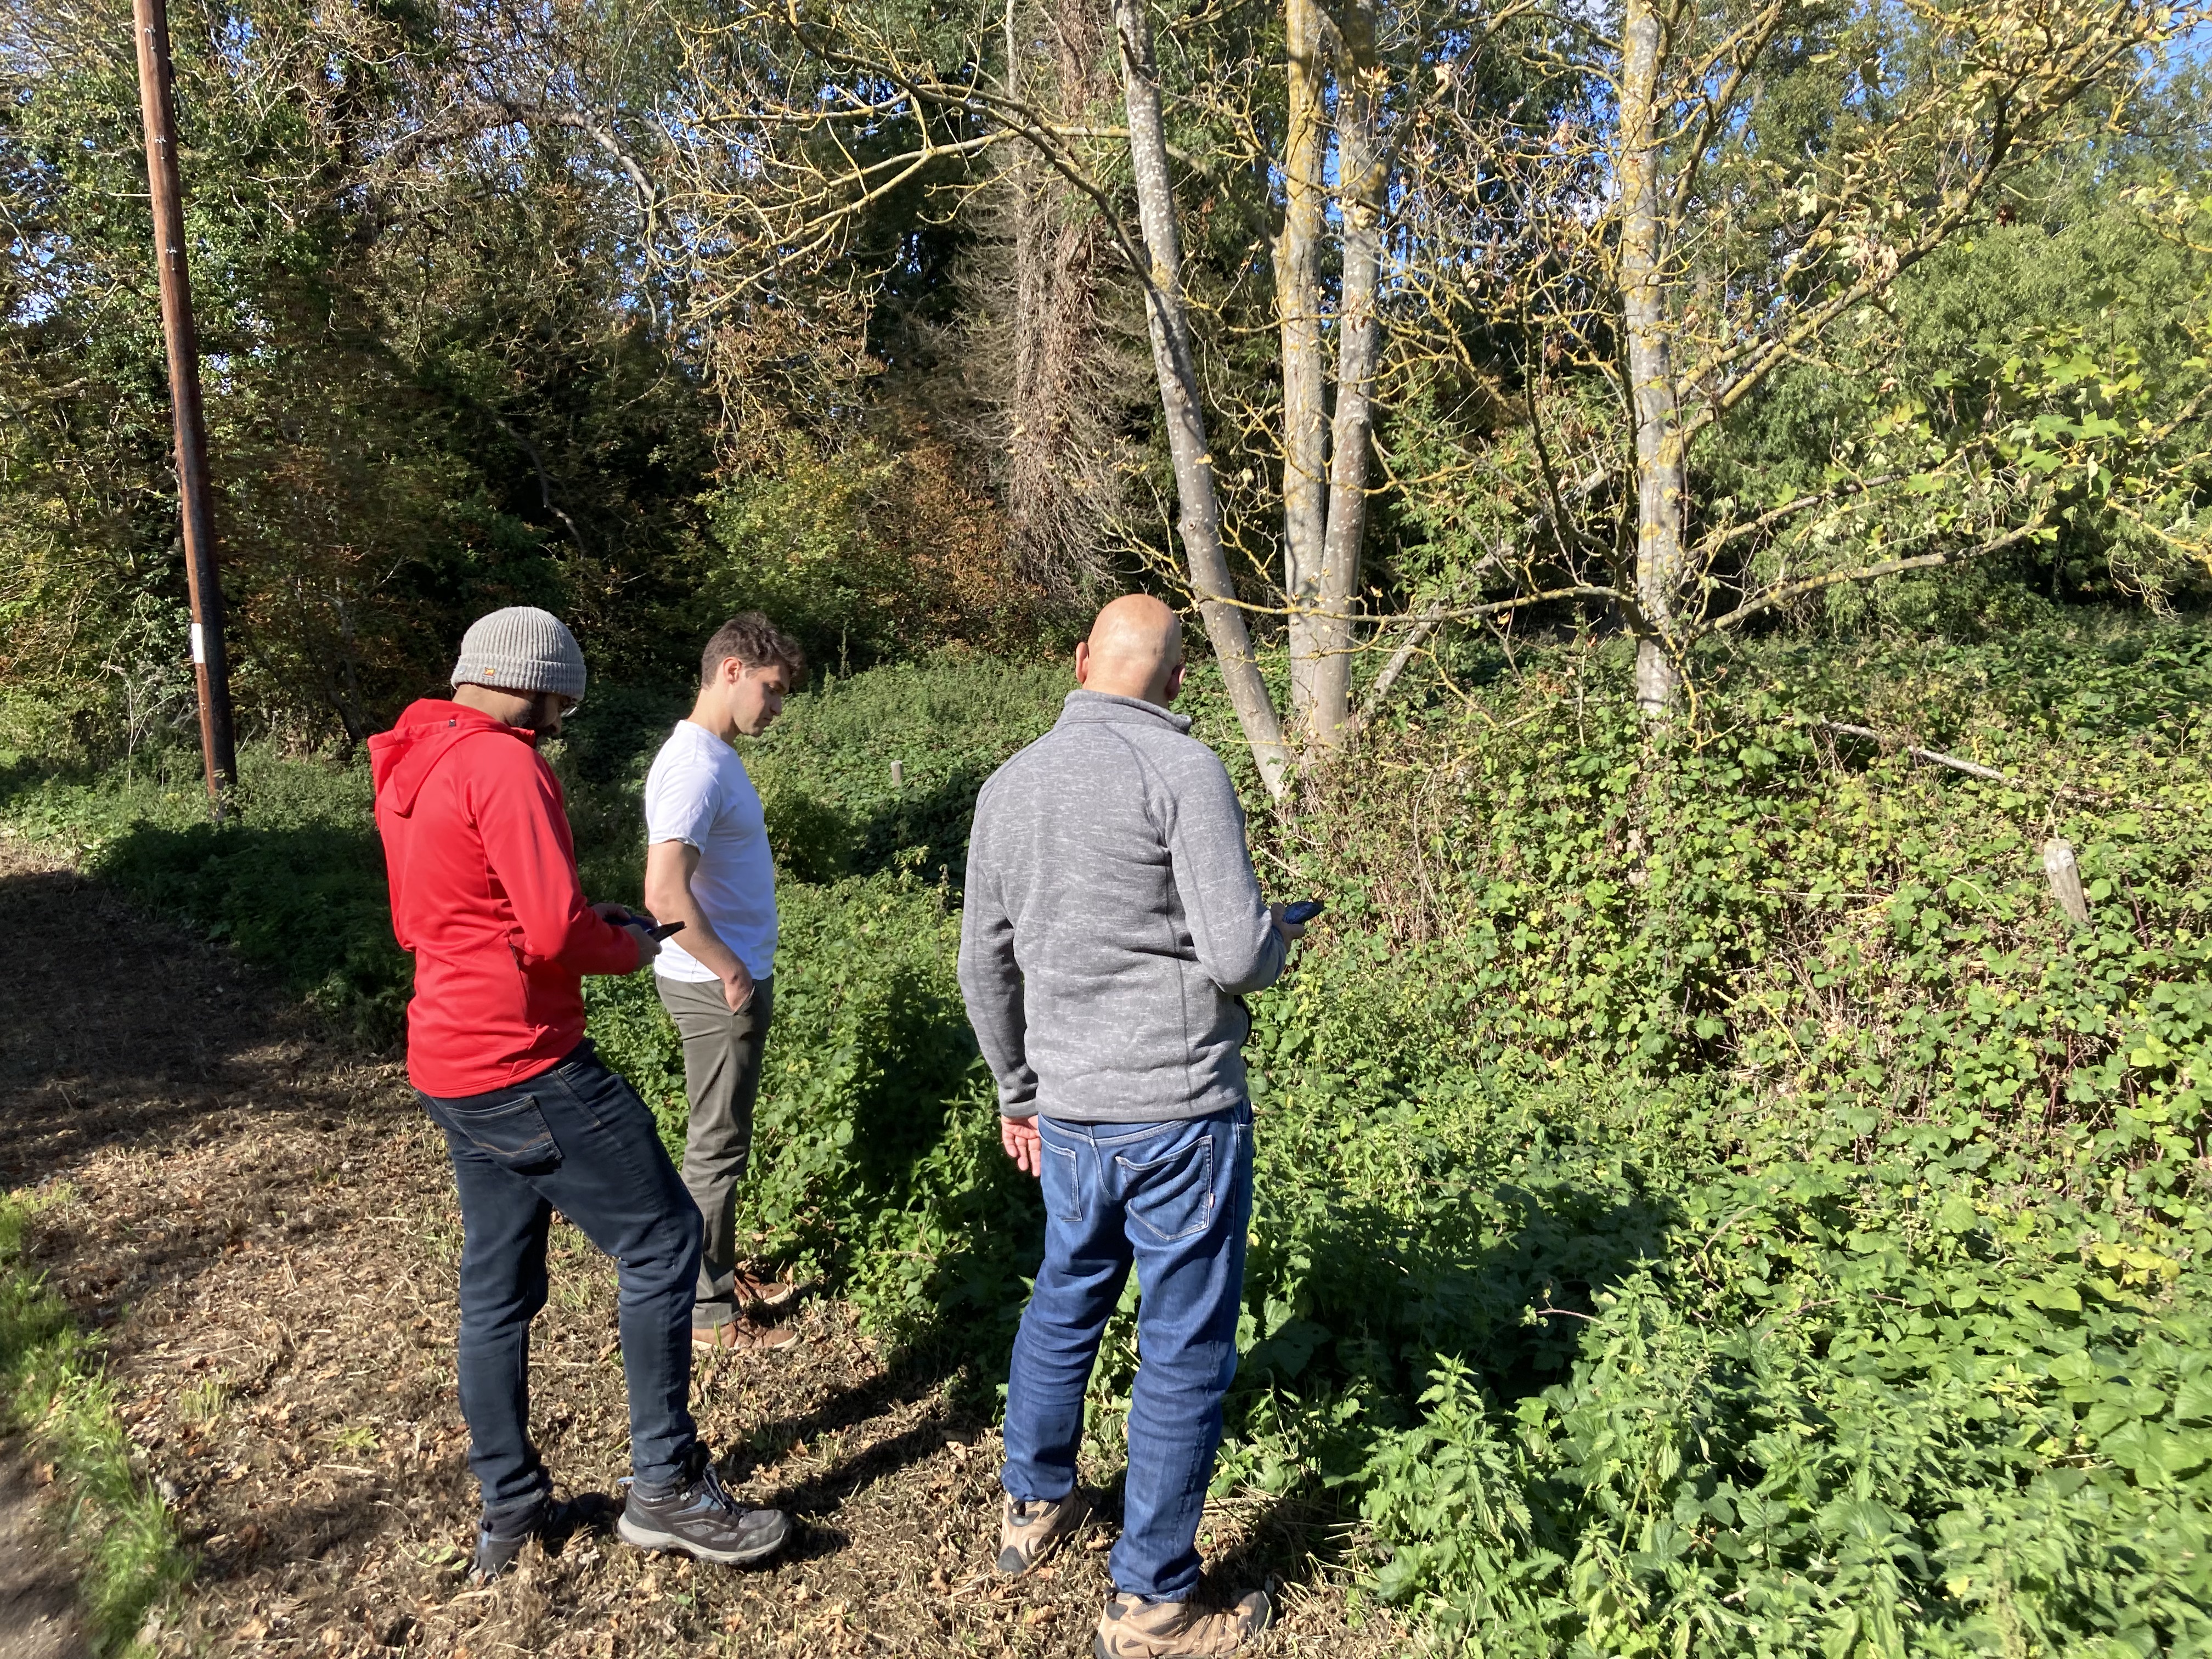
Generally speaking, I think the models performed quite well. Usually one or more of the models were able to detect large deposits of brambles, and, quite surprisingly, put together the models frequently spotted even brambles covered from above (by trees, in most cases).
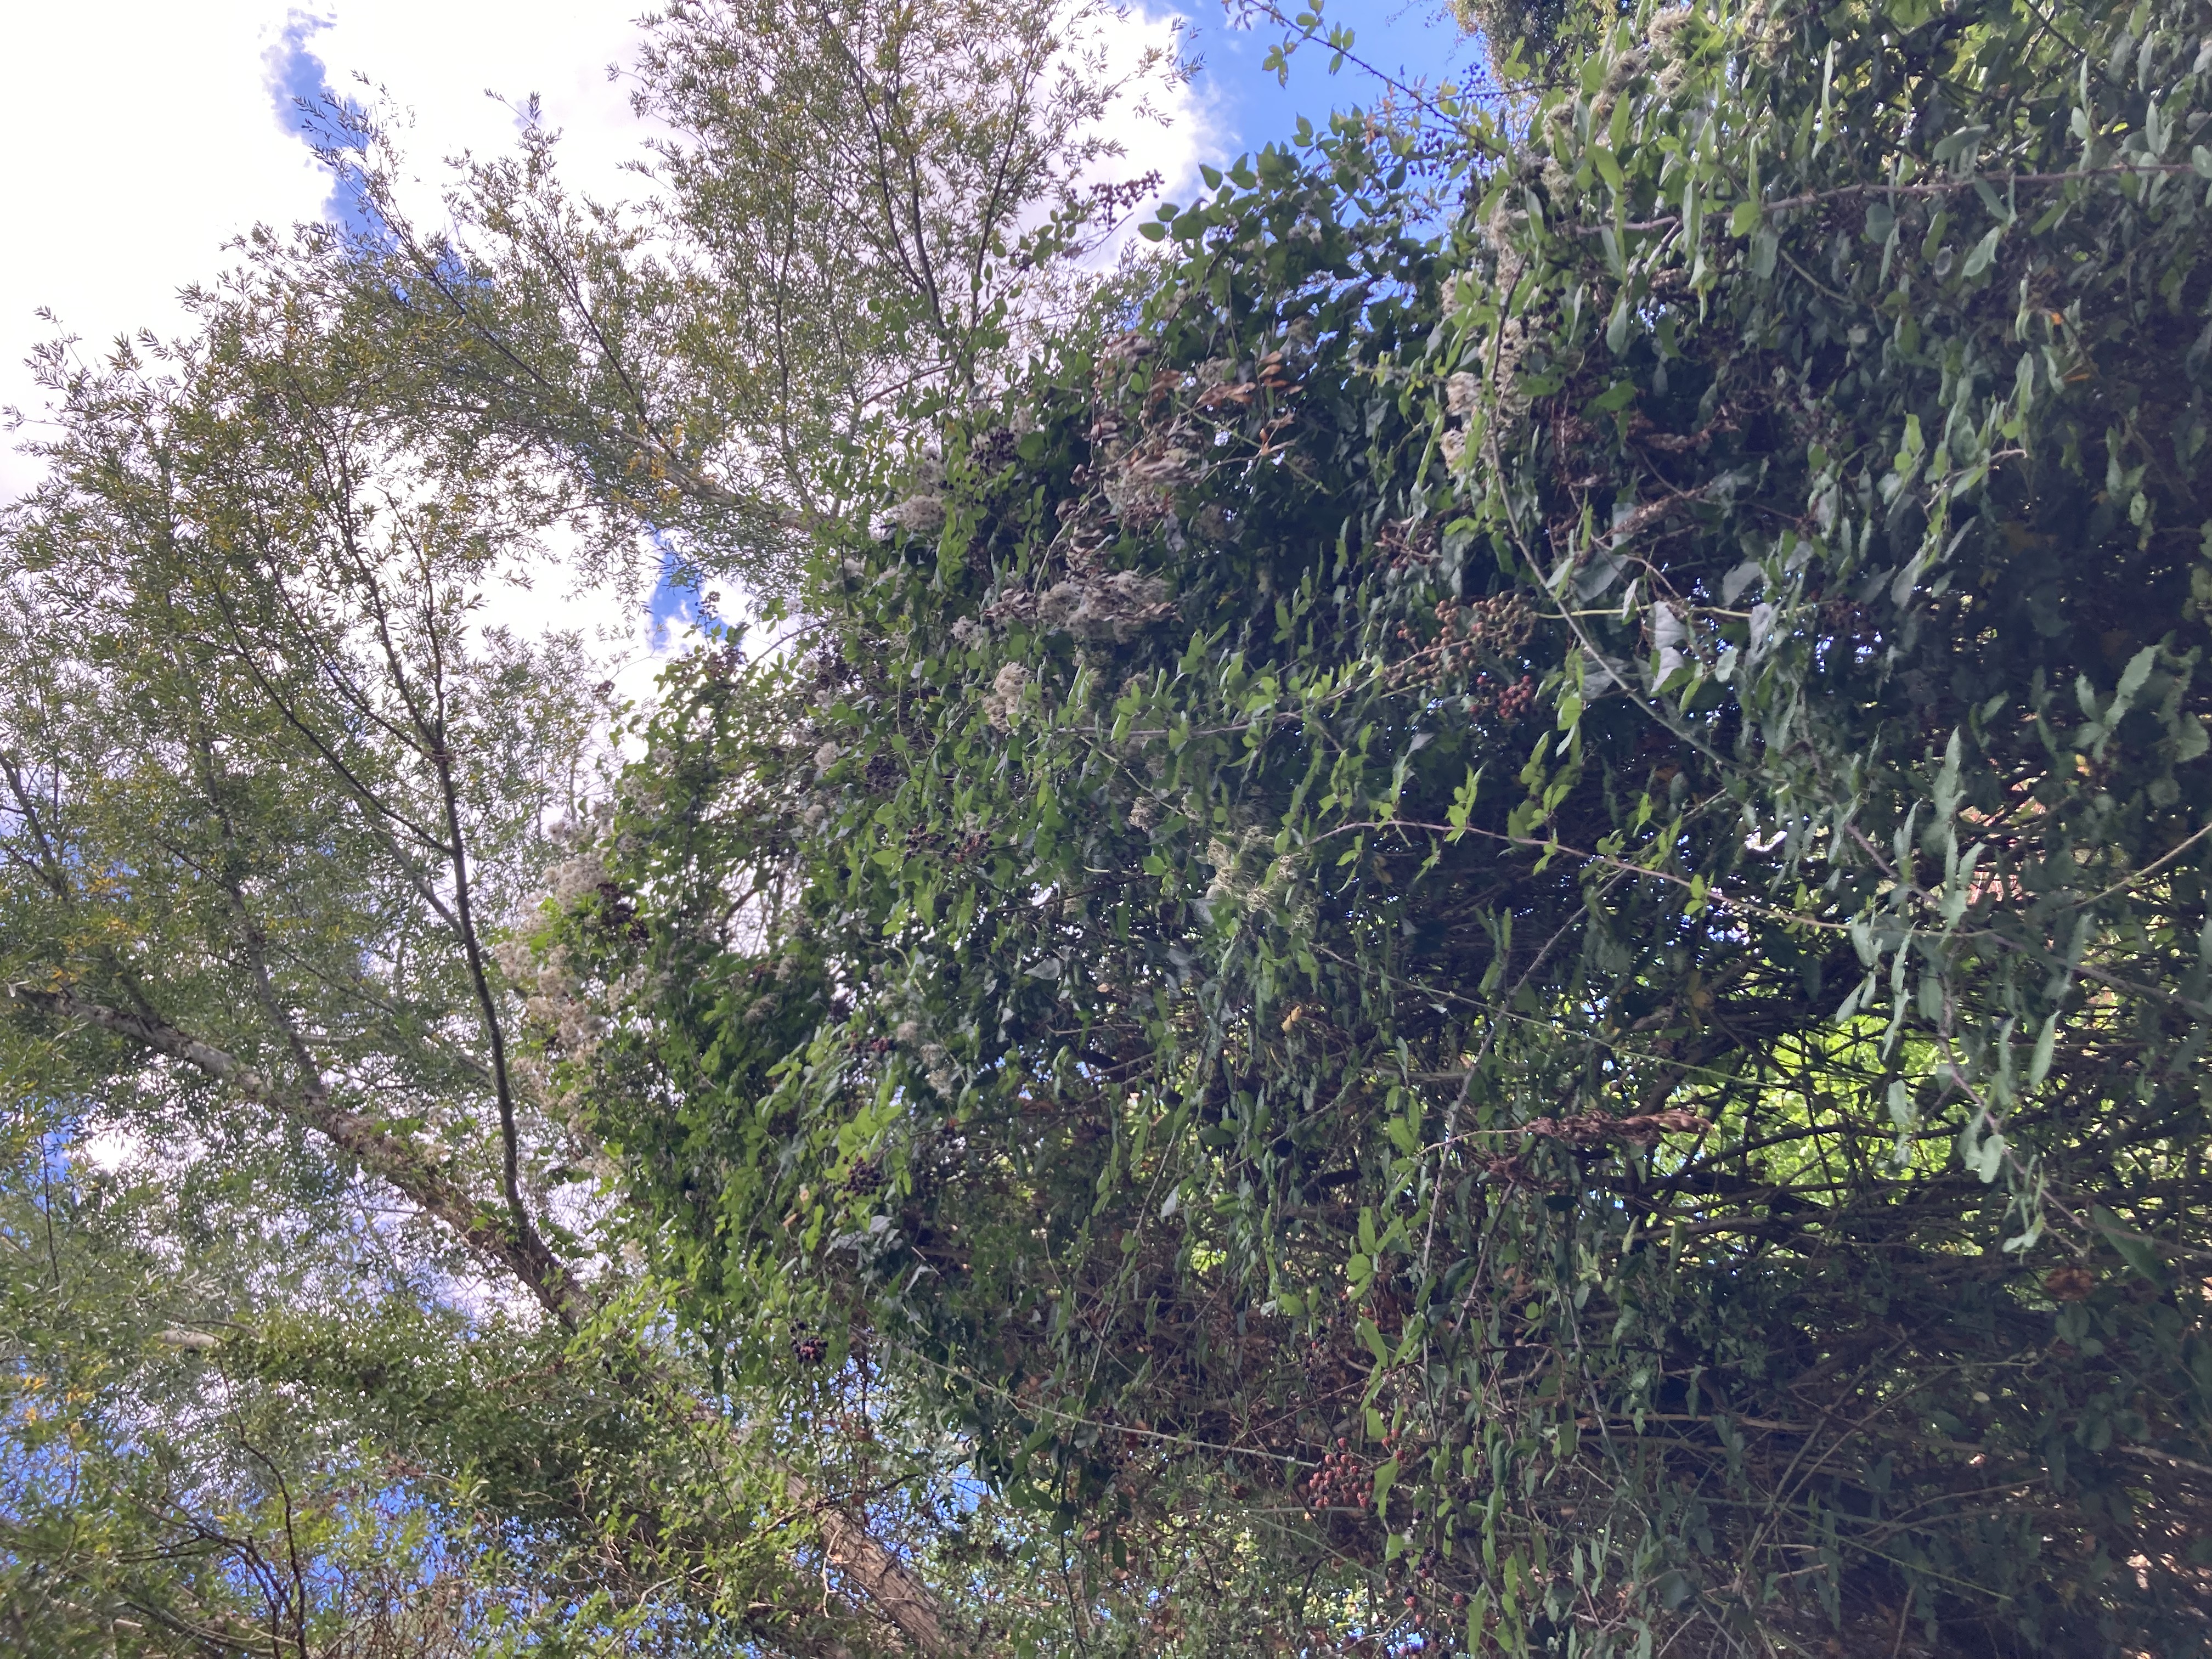
The vertical coverage also became the one classification criterion I used after our field trip. After we collected the data, I used satellite imagery & street view to correct the coordinates (as my old-ish iPhone’s GPS turned out to be really inaccurate), and classify brambles by clearly visible and concealed from space. I’m not 100% certain how the models perform so well when classifying the concealed brambles - it’s probably some combination of “invisible” features that get caught by TESSERA and the landscape context. For the final training, I therefore used the data collected by hand and the manually filtered data collected from iNaturalist (the data - nearly 70 classified brambles - available for download here: ⬇️ Cambridge Brambles Geojson) classified into covered and non-covered to train two sets of models (KNN, SVM, and logistic regression – since MLP just didn’t work well).
Then, I just used these four models in a simple ensemble, each model having received one vote per pixel. The classification for Cambridge and its surroundings viewed below:
Feedback
Overall, I believe the obtained results are pretty convincing, and, more than anything, are a sign of the power of the TESSERA foundational model.
Nonetheless, I’m glad there has been some recognition of this specific use case. Probably due to Dr Jaffer’s post on his website, the Ars Technica news outlet, also wrote about this project, and supposedly there was a segment on French national TV (which I sadly missed as I was offline for a few days).
Summer’s work index
As this is the last post related to my summer internship, I also wanted to include a brief index of links to my past posts in a slightly more organized fashion.
🦔🦔🦔🦔 Hedgehogs
- Introduction, hedgehog & data overview
- More data, starting with statistical models for animals’ step selection; planning out further use of the statistical coefficients.
- More data extraction; locking down on integrated step analysis functions (iSSA) first (rather constrained) coefficients
- More iSSA (focusing on temporal co-variates); extraction of sleeping habitats; getting first bramble results
- Adding time-of-day to the ABM & exploration of available space and barriers
- Writing up & more debugging of the ABM
- Finishing the ABM model; hedgehogs GPS traces applied to model landscape walkability with TESSERA
🌱🌱🌱🌱🦔🌱🌱 Brambles sub-problem
- Explanation to why brambles are relevant; connection to TESSERA
- First results - using TESSERA & iNaturalist
- Experiments with models; filtering available data
- Prepping for fieldtrip
- Fieldtrip & wrapping up the brambles (- this post)
🚶Walkability
- Brief introduction
- Resuscitating my walkability evaluation thesis codebase; trying to come up with evaluation solutions
- Experimentation with combining TESSERA satellite imagery-based embeddings with semantic embeddings derived from OSM
- Transition to h3 geospatial grids & generation of on-segment and off-segment maps
- Exploring human GPS traces to model off-segment walkability - first experiments
- Seemingly good results for off-segment walkability - h3 & TESSERA & human GPS traces-based